A POPULATION DATA ATLAS
Global Myopia Statistics: What the Numbers Do and Do Not Say
Understand myopia statistics by population, age, study year and outcome. Read prevalence estimates and the 2050 projection without mixing them together.Check who each statistic describes ↓
Myopia is common, but a global percentage is not a diagnosis or a personal forecast. A 2024 review pooled studies of children and adolescents; an often-cited 2050 projection concerns all ages. Check the population, study years, definition, and uncertainty before comparing statistics.
On this page
Start with the population behind the number
A myopia statistic needs a population, a time period, and a method. “One in three children” and “half the world by 2050” may appear beside each other in a headline, but they do not describe the same people or the same kind of evidence. One may summarize studies already conducted; the other may be a forecast. Reading them as a single timeline can be misleading.
VISUAL GUIDE 1 / 3
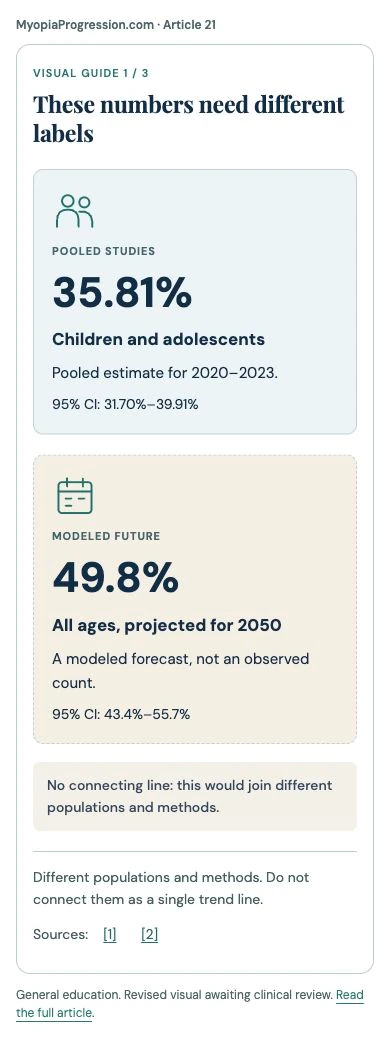
These numbers need different labels
No connecting line: this would join different populations and methods.
A large systematic review published online in 2024 brought together 276 studies with 5,410,945 participants from fifty countries. It examined children and adolescents. Its pooled estimates give a broad view of the research, rather than a count of every child in every country. [1]
That distinction does not make the result unimportant. It tells you what the evidence can support. A pooled estimate can describe a pattern across many studies while still leaving uncertainty about a particular country, school, age, or child.
Before sharing a number, finish the sentence: “This is an estimate of [what], in [whom], during [which period], based on [which evidence].” If those blanks cannot be filled, the statistic is not ready to guide a conclusion.
What the child and adolescent review found
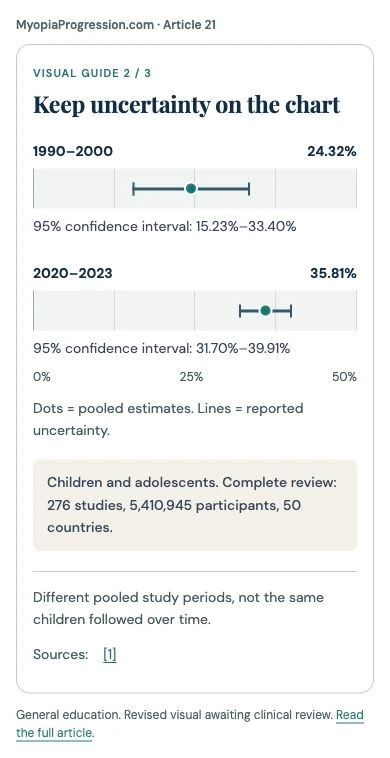
The review's pooled myopia prevalence estimate was 24.32% for the 1990–2000 period and 35.81% for 2020–2023. Prevalence means the proportion who had myopia, rather than the proportion newly developing it during a specified follow-up. [1]
VISUAL GUIDE 2 / 3
Keep uncertainty on the chart
95% confidence interval: 15.23%–33.40%
95% confidence interval: 31.70%–39.91%
Dots = pooled estimates. Lines = reported uncertainty.
Children and adolescents. Complete review: 276 studies, 5,410,945 participants, 50 countries.
The confidence intervals also matter. For the earlier period, the reported 95% confidence interval was 15.23% to 33.40%; for the later period it was 31.70% to 39.91%. These intervals show statistical uncertainty around the pooled estimates. They are not ranges within which a child's prescription will change. [1]
The chart intentionally shows only the two stated periods, with their uncertainty. It does not draw an invented year-by-year path between them. The periods combine different contributing studies. They are not repeated examinations of exactly the same children over three decades.
A parent can reasonably understand the review as evidence of a major public-health concern. It is less reasonable to use its global pooled estimate as the exact percentage for a child's classroom. A local estimate needs relevant local evidence and an understanding of the age group and examination method.
Prevalence, incidence, progression: three different questions
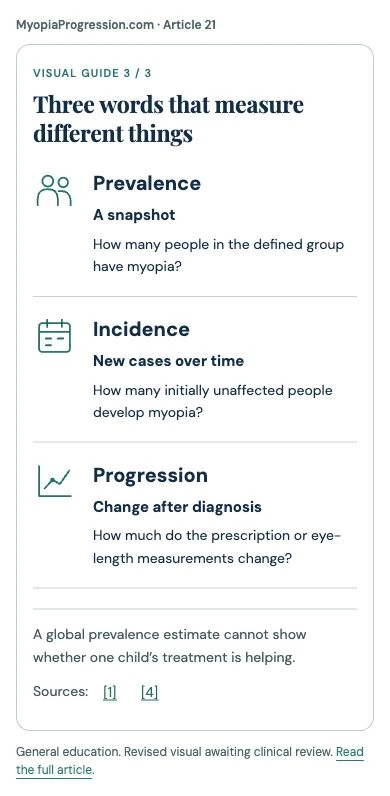
Prevalence asks how many people in a defined group have myopia at a given time or period. It is useful for thinking about the scale of a condition and the need for services. It does not describe how fast one affected child's eye is growing.
Incidence asks about new cases over an interval among people who did not already have the condition. In a prevention study, this helps answer whether an intervention reduced the development of myopia. It is a different outcome from the amount of progression after diagnosis.
Progression concerns change after myopia is present, often assessed through prescription and, where available, eye-length measurements. A prevalence survey cannot tell a family whether a particular child's treatment is helping. The National Eye Institute explains myopia and the role of an examination in individual care. [4]
These terms are often blurred in short posts. A claim about fewer new diagnoses should not become a claim about a particular millimeter reduction in existing myopia. A rising population prevalence should not become a prediction that every diagnosed child will develop high myopia.
VISUAL GUIDE 3 / 3
Three words that measure different things
A quick reading check
Ask whether a percentage refers to people or change. “Thirty percent of participants had myopia” describes people. “A treatment reduced average progression by a percentage relative to a comparison group” describes a comparison of outcomes. They cannot be swapped simply because both use a percent sign.
The 2050 headline is a forecast about all ages
A widely cited modeling paper published in 2016 projected that 49.8% of the world's population could have myopia by 2050. Its reported 95% confidence interval was 43.4% to 55.7%. This is an all-age projection, not an observed 2050 result and not a child-only prevalence estimate. [2]
A forecast depends on data and modeling assumptions. It is a way to examine a possible future burden, not a scheduled event that must happen to every population. The year 2050 has not been observed in the evidence used to make the projection.
Do not connect the review's 35.81% child-and-adolescent estimate to the model's 49.8% all-age forecast with a line and describe the difference as the rise in one consistent population. The age groups, evidence, and purposes differ. A visually smooth chart can conceal an invalid comparison.
The practical value of the forecast is planning: eye-care access, clear-vision correction, research, and public-health priorities. It should not be used as a frightening prediction about an individual child's future vision. Ask what the number means for service needs, then return to the child's own examination for care decisions.
Why studies and regions can produce different estimates
The studies in a large review do not all ask exactly the same question in the same setting. Age composition, location, examination methods, and definitions can affect estimates. A school survey and a population sample may also include different people. Read the methods before treating a percentage as directly comparable with another one. [1]
A global average can hide substantial variation. It is not a fair substitute for a local study when a school wants to understand its own pupils. Likewise, a high estimate from one setting should not be assigned to a child solely because of ethnicity. Population research and individual assessment serve different purposes.
Access to eye care also matters when interpreting what a family notices. A classroom photograph showing children with glasses cannot reveal how many children are myopic. Glasses can be prescribed for other refractive errors, and some children who need correction may not have it. A picture is not a diagnostic survey. [4][3]
If a news story gives a startling local figure, look for the original source. Which ages were included? Were children actually examined? How was myopia defined? Was the sample representative? If the article cannot answer those questions, quote it cautiously or choose a better source.

Public health and an individual child's care meet in access
The World Health Organization's World report on vision describes the wider importance of eye-care access and unmet need. Its broad figures on vision impairment should not be relabeled as counts of myopia. They concern a wider set of conditions and services. [3]
For a school or community, useful questions include whether children can obtain an examination, receive appropriate correction, and get follow-up when needed. A dramatic forecast alone does not tell an institution which barriers families face locally. Those barriers may include cost, travel, appointment availability, or understanding the need for care.
For a family, the first useful information is the child's own result. What is the prescription? What has changed? Is eye health satisfactory? What follow-up is recommended? Those questions remain important whether a global estimate rises or falls.
Do not use a public-health statistic to blame a child for reading, learning, or belonging to a group with a higher reported prevalence. Research can identify patterns without assigning personal fault. A helpful conversation focuses on access, suitable routines, and evidence-based care rather than turning a trend into a judgment.
A small checklist for sharing statistics accurately
When you save or share a figure, keep the source link and publication year with it. Include the population and whether the figure was observed, pooled, or projected. If the source gives uncertainty, retain it where practical rather than presenting the estimate as an exact count.
Your statistic source check
Discussion prompts only. Check marks stay on this open page; nothing is submitted or stored. This tool does not diagnose, choose a treatment, or set a dose.
If two sources appear to disagree, compare their definitions before deciding one must be wrong. Different ages or time periods may explain part of the difference. A newer publication date also does not automatically mean newer data. Check when the underlying observations were collected.
The American Academy of Orthokeratology and Myopia Control (AAOMC) offers patient resources that can help families move from broad concern to informed questions about myopia management. [5] Those questions should be connected to the child's own examination, not answered by a global percentage.
The numbers support taking myopia seriously as a public-health issue. Read carefully, they also show why responsible communication needs context. A population estimate can explain scale; it cannot replace a diagnosis, choose a treatment, or tell a family exactly what will happen to their child.
CHECK THE EVIDENCE
Sources & references
Primary research, guidance, and patient resources. Checked October 21, 2026.
- 1Global childhood myopia: systematic review and projectionsLiang et al. · British Journal of Ophthalmology · 2024
- 2Global myopia and high-myopia projections to 2050Holden et al. · Ophthalmology · 2016
- 3World report on visionWorld Health Organization · 2019
- 4Nearsightedness (myopia)National Eye Institute
- 5Patient resourcesAmerican Academy of Orthokeratology and Myopia Control (AAOMC)
General education. This article does not replace an eye examination, individual advice, or the prescribed care plan.