Eye-care professionals
A MEASUREMENT INTERPRETATION LAB
Monitor Myopia Progression: Measurements, Trends and Decisions
For clinicians: check measurement comparability, each eye and the actual interval before interpreting myopia trends or discussing treatment changes.Check whether measurements are comparable ↓
Interpret refraction, axial length, vision and ocular health together, using repeatable methods and the actual interval between visits. Check measurement quality and treatment use before calling a change treatment failure. Set a follow-up plan that fits the modality, age, findings and safety needs.
On this page
Identify the decision the measurement is meant to support
A follow-up visit may ask whether vision is adequately corrected, whether the eye is changing, whether a treatment is tolerated, or whether a new symptom needs investigation. Those questions overlap, but they do not have the same answer or test.
Begin with the clinical question and the patient's account. Ask about vision in actual tasks, symptoms, current correction, prescribed treatment use and practical difficulties. A trend chart should not replace that history.
Refraction describes optical focusing. Axial length describes the distance along the eye measured by the instrument's method. Visual acuity describes performance on a task under specified conditions. Ocular-health assessment addresses structures and disease. The IMI instrumentation report distinguishes these measurement domains. [1]
Record which question each result helps answer. This prevents a clear acuity result being used as proof of stable eye growth, or a changed eye-length value being treated as an explanation for every symptom.
VISUAL GUIDE 1 / 3
Four measurements answer different questions
Refraction · diopters
Assesses: Optical focusing under the recorded conditions
Does not establish alone: The exact amount of axial growth
Axial length · millimeters
Assesses: Eye length and its change with repeatable measurement
Does not establish alone: Lens fit, comfort or every cause of blur
Visual acuity · recorded method
Assesses: Performance on a specified visual task
Does not establish alone: Stable eye growth or absence of ocular disease
Ocular health · clinical findings
Assesses: Structures, symptoms and disease concerns
Does not establish alone: The entire treatment-response story
Check quality before calculating a trend
Confirm the correct patient, eye, dates and instrument. Review alignment, quality indicators and repeatability according to the device instructions. Investigate an unexpected result rather than accepting it because a number has been printed.
Record relevant conditions. Refraction measured with and without cycloplegia should not be silently combined as though the methods were identical. A change in instrument or protocol can also affect the interpretation of a small difference.
Save the underlying measurements and the reason for excluding or repeating a reading. A final average without the acquisition context may be difficult to evaluate later. Training should include how to recognize data that are insufficient for the intended decision.
Treat missing data explicitly. If axial length is unavailable, document the limitation and use an appropriate clinical assessment and follow-up plan. Do not fill the gap by converting a refractive change into an invented eye-length measurement.
VISUAL GUIDE 2 / 3
A trend starts with a comparable pair of measurements
Correct child, eye, actual dates and metric.
Follow the device or test method and review quality.
Check protocol, treatment context and actual interval.
Review vision, health, treatment use and uncertainty.
Record the reason for continuing, reassessing, changing or referring.
Compare the same eye over the actual interval
Review the dates before interpreting a difference. A change over three months and the same change over a year are not the same observation. Keep left and right eyes distinct and check that the baseline is clinically meaningful.
A rate can be calculated from the change divided by elapsed time, but an annualized value from a short interval is still an estimate based on that interval. It is not a measured full-year outcome. Measurement variability and timing can make short-interval extrapolation misleading.
Use actual values when discussing an actual patient, with units and methods visible. This article does not supply fictional patient trajectories that could be mistaken for study data or normal targets. The schematic below organizes the interpretation steps without inventing numbers.
Age, prior trajectory, treatment and clinical findings all contribute to interpretation. A single universal cutoff should not replace that assessment. A population growth reference can provide context, but it does not determine an individual treatment decision by itself.
VISUAL GUIDE 3 / 3
Measured change, rate and treatment effect are different
A measured difference in the same eye and metric.
An interval-based rate. A short interval is not a measured full year.
Do not claim an exact individual treatment percentage using a guessed counterfactual.
Keep treatment effects and measurement effects distinct
The current correction and modality affect which results are comparable. Ortho-K changes corneal optics; a routine refractive result during treatment cannot automatically be read as if the patient had been using ordinary spectacles alone.
For overnight lenses, record the lens design, relevant wear and removal history, visual performance and corneal findings. Use product-specific instructions and clinical judgment for the assessment. A manufacturer fitting guide supports that design's care rather than every possible lens system. [4]
For other treatments, record changes in product, prescription, formulation or use that may matter to the review. If the plan changed between visits, a graph should show that context rather than implying one continuous intervention.
Do not equate a successful task with a complete treatment response. Comfortable wear and usable vision are important outcomes, but they do not independently establish the progression effect. Similarly, continued measured change does not automatically mean the treatment had no benefit compared with an unknown untreated course.
Review safety and the lived routine beside the numbers
Ask how the treatment is being used and whether the patient can maintain it. A response that looks unexpected may involve a supply interruption, misunderstanding, poor fit, intolerance or another factor that needs its own assessment.
Use a neutral question: “Talk me through what happens on a normal day.” This can uncover a practical issue without beginning with an accusation. Record the actual pattern rather than a generic adherence label.
Ocular health and new symptoms require attention regardless of how reassuring a trend appears. Do not use a stable axial value or a smaller prescription change to dismiss pain, redness or reduced visual function.
The IMI 2025 Digest frames long-term management around progression, safety, vision, quality of life and treatment acceptance. That broader set of outcomes helps prevent a chart from becoming the sole definition of success. [2]
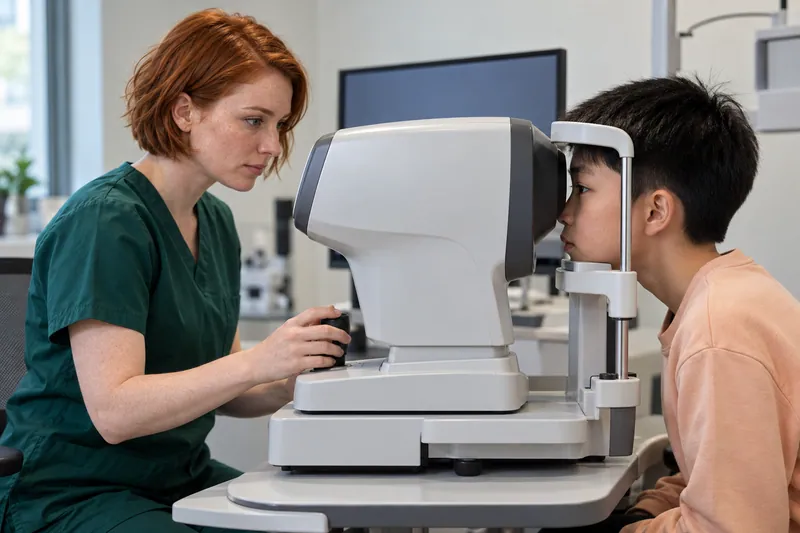
The fictional measurement scene demonstrates the setting, not a diagnostic result. The displayed data are not a patient record or a clinical example.
Decide what the available evidence can justify
After checking quality and context, state the conclusion at the level the data support. There may be enough information to continue the plan, investigate further, arrange earlier review, adjust treatment or refer. There may also be a meaningful limitation that should remain visible.
Avoid claiming the exact percentage effect for one patient by comparing observed change with a guessed untreated trajectory. Trial comparisons describe groups; an individual's counterfactual course is not directly measured.
If change remains concerning, review the clinical findings, treatment suitability, actual use, safety and alternatives. The decision belongs in a shared discussion, with the reason and expected next assessment documented.
The IMI clinical-management guidance supports ongoing review and adjustment when appropriate. It does not replace the clinician's assessment with a stand-alone number. Use the risk communication framework when explaining why the next step is recommended. [3]
Write a note that can survive a handoff
A useful monitoring note includes the clinical question, methods, dates, relevant results, treatment context, safety findings, interpretation and next step. Keep the distinction between measured fact and clinical interpretation clear.
If a reading was repeated or judged unreliable, document that. If the patient reports a barrier, state what it was and what support was agreed. If another clinician needs to review the result, name the owner of that action.
Set the next appointment and the reason for its timing. Different stages of fitting, treatment initiation, stable follow-up and new concerns can require different intervals. Do not use a single template interval as though it applied to every modality and child.
Give the family a shorter explanation they can use at home. They should know what changed, what the plan is meant to do, what is uncertain and which symptoms should prompt contact before the booked review.
Make a trend display honest and readable
Label the eye, metric, unit, measurement method and actual dates. Show when treatment or the measurement protocol changed. A graph without that context can imply a comparison that the record does not support.
Use a sensible scale and avoid visual exaggeration. If a display includes a population reference or prediction model, identify the source, intended population and limitations. Do not label a modeled future path as the child's measured outcome.
For small differences, retain the quality context and uncertainty in the explanation. Adding more decimal places does not make the clinical inference stronger. A display should help a clinician and family understand the record, not create an impression of precision beyond the method.
When showing a study instead of a patient trend, identify that explicitly. Keep study outcomes, time periods and populations separate from the child's own measurements.
Review the monitoring system as well as the patient
Check whether the practice can retrieve comparable data and identify missed reviews. A careful interpretation at one visit can be undermined by a missing baseline, an unrecorded instrument change or a follow-up that never gets booked.
Train the team to escalate unexpected results and to retain the original record. Equipment access and clinical interpretation should have named responsibilities and cover during staff absence.
The American Academy of Orthokeratology and Myopia Control (AAOMC) offers professional education that can support continuing development. Its inclusion does not imply endorsement of this monitoring framework. [5]
Use the worksheet to review the completeness of a monitoring decision. It does not calculate a diagnosis, assign a normal growth target or choose a treatment.
Your monitoring decision
Discussion prompts only. Checks stay on this open page; nothing is submitted or saved. This sheet does not diagnose, choose treatment or determine urgency. Do not delay urgent care to complete it.
CHECK THE EVIDENCE
Sources & references
Research, professional guidance and patient resources. Checked October 22, 2026.
- 1IMI: Myopia Management InstrumentationInternational Myopia Institute · IOVS · 2025
- 2IMI 2025 DigestInternational Myopia Institute · 2025
- 3IMI Clinical Management Myopia Guidelines ReportInternational Myopia Institute · 2019
- 4Optimum Infinite Orthokeratology Lenses II: Professional Fitting and Information GuideManufacturer labeling in FDA PMA P240045 · 2026
- 5Practitioner Education and ResourcesAmerican Academy of Orthokeratology and Myopia Control (AAOMC)
General education. This article does not replace an eye examination, individual advice, or the prescribed care plan.